Correlating metrics and logs
I wanted a(nother) quick way to troubleshoot spikes in CPU usage on my servers based on CPU metrics and then correlate the spikes with the relevant server logs, to (hopefully) identify the root cause of the CPU spike.
Since I’ve been playing around using Loki for logs lately (e.g. to consume RFC5424-based syslog from VMware ESXi), I thought it would be fun to visualize both logs and metrics simultaneously, using Grafana. I know there are multiple (good) examples of setting up rather complex views of both metrics and logs, this trying to be a rather simple one, based on how I’m using it.
In the example(s), I will be using:
- Metrics stored in Prometheus
- Currently using node_exporter for scraping
- Logs stored in Loki
- Currently using promtail to ship the logs.
- Visualizing both metrics and logs (simultaneously) in Grafana
I also created a simple (but powerful) Grafana Dashboard to quickly switch between contexts. In the dashboard, I thought it would be relevant to have:
- Quick overview of CPU usage metrics, mainly to identify patterns like spikes and trends.
- Details from the logs, mainly to get additional information on what is going on.
- Both system and application logs, if possible.
- A way to correlate the CPU usage metrics with the logs (being the key here 🔑), using the same view, same sources, and same timespan.
- An easy way to switch between servers to troubleshoot, based on the server name
- Using dashboard variables and regex
- An easy way to quickly drill down (and out) into specific patterns, mainly using the graph view (visualizing metrics), and simultaneously defining a timespan for the logs to view.
- A possibility to filter logs quickly, based on custom text input
- Using dashboard variables
- (hopefully) finding the root cause of a CPU usage spike, all in one place.
- .. and ”the answer is usually in the logs” (you may quote me on that one).
Detecting unusual CPU spikes based on CPU usage pattern
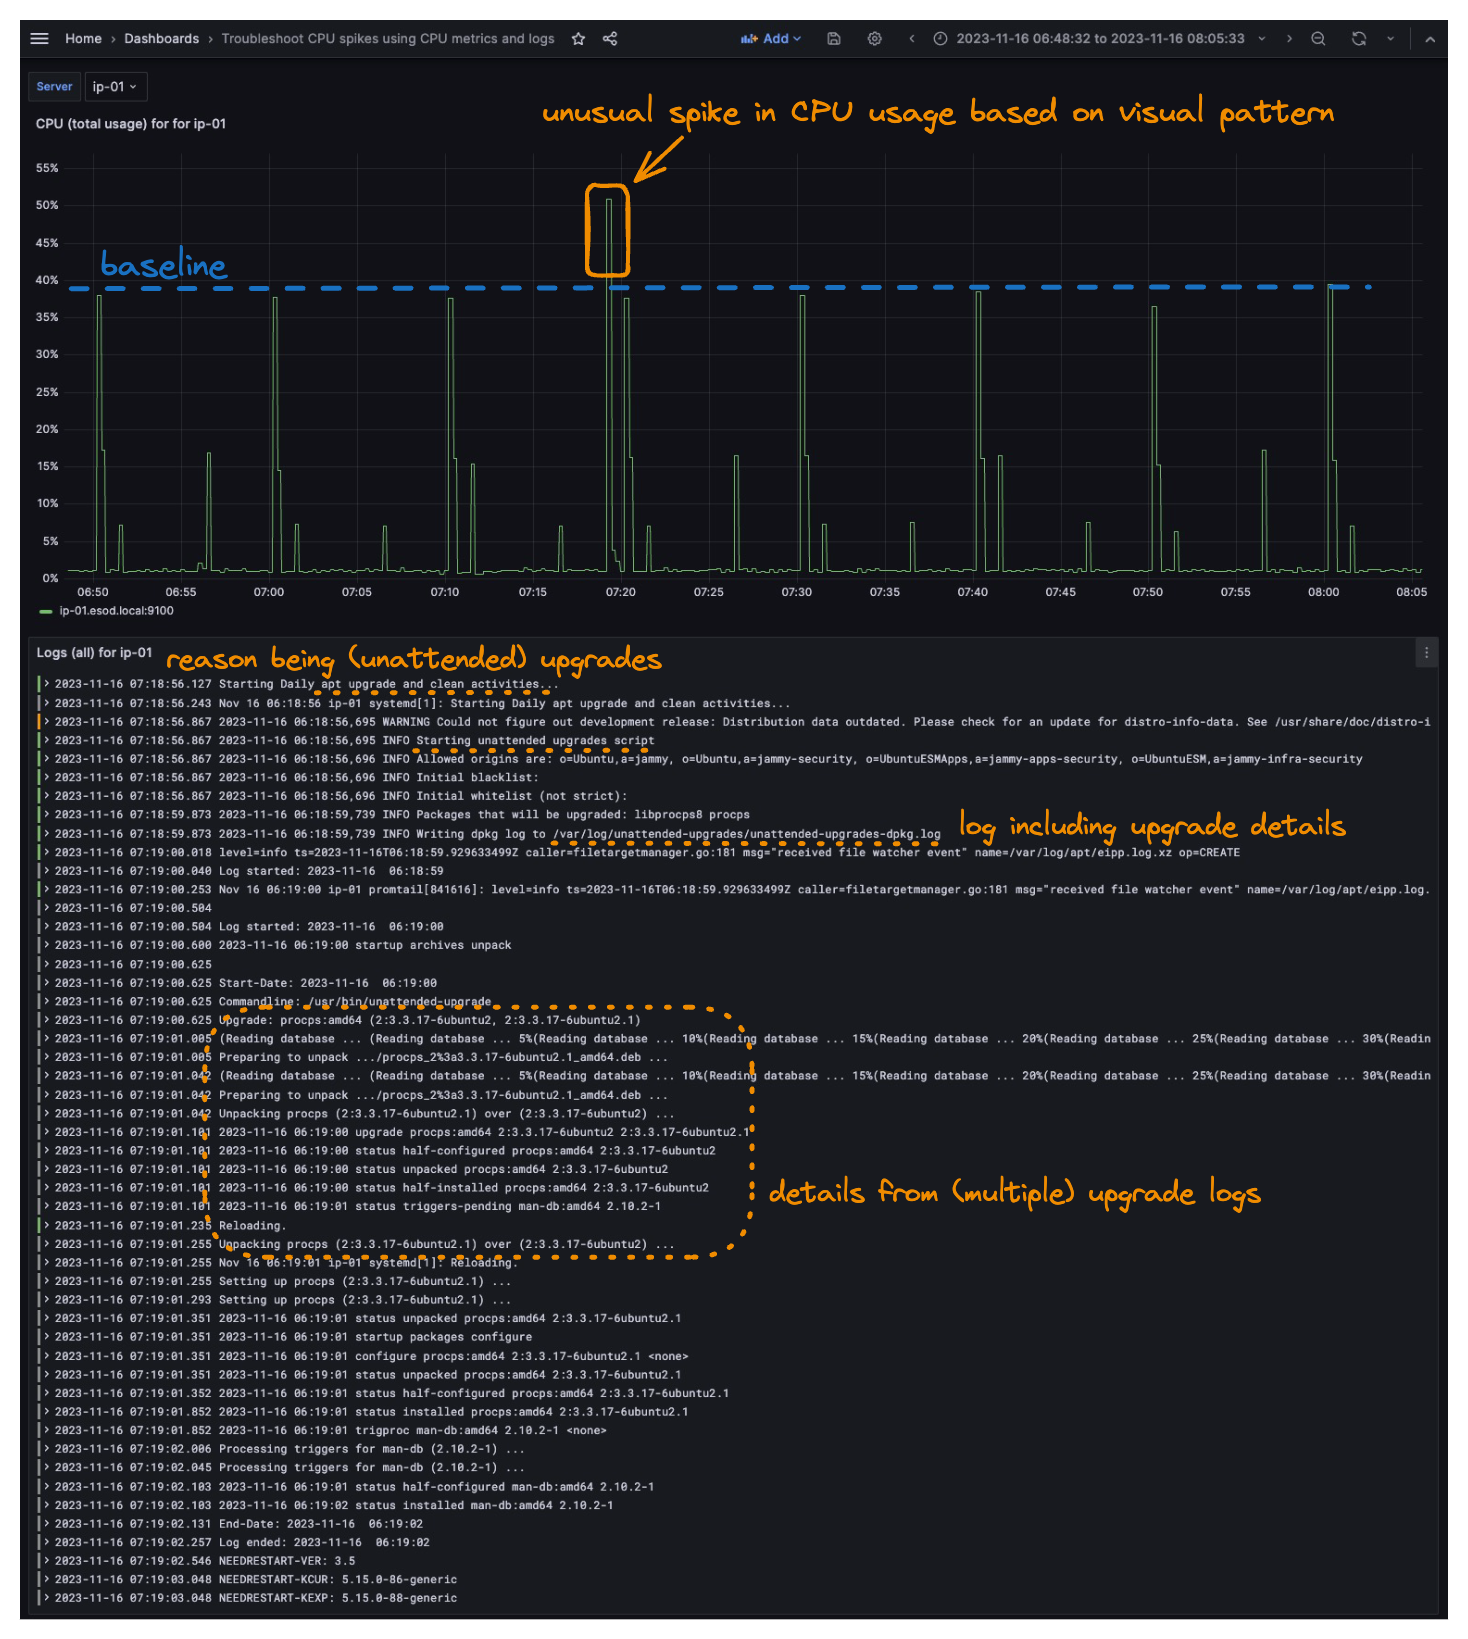
Hopefully, the annotated screenshot should help to illustrate what’s possible, but for the non-visual creatures, the findings go as:
- I noticed an unusual CPU usage spike around 07:20 based on the CPU usage metrics. Originally from viewing metrics between several hours (e.g. last 6h, 12h, or 24 hours), but zoomed in a bit below, for clarity.
- By simply “zooming into the spike in CPU usage” (selecting the time range by mouse), the log view is immediately updated and reflects exactly what is happening on the specific server, at the specific timespan I zoomed into.
- In the logs, I quickly see that a scheduled and unattended apt upgrade job has been started, at the specific timeframe of the CPU usage spike (being the what).
- In the logs, I also see packages being upgraded (being the reason for the spike in CPU usage).
So by correlating metrics and logs simultaneously I quickly identified an unusual pattern and then discovered both the “what and why”; all within seconds! And not to mention without the need to log into multiple servers, having to check multiple logs, and further deducting based on timestamps. Pretty cool, huh?
Variables used in the Grafana Dashboard
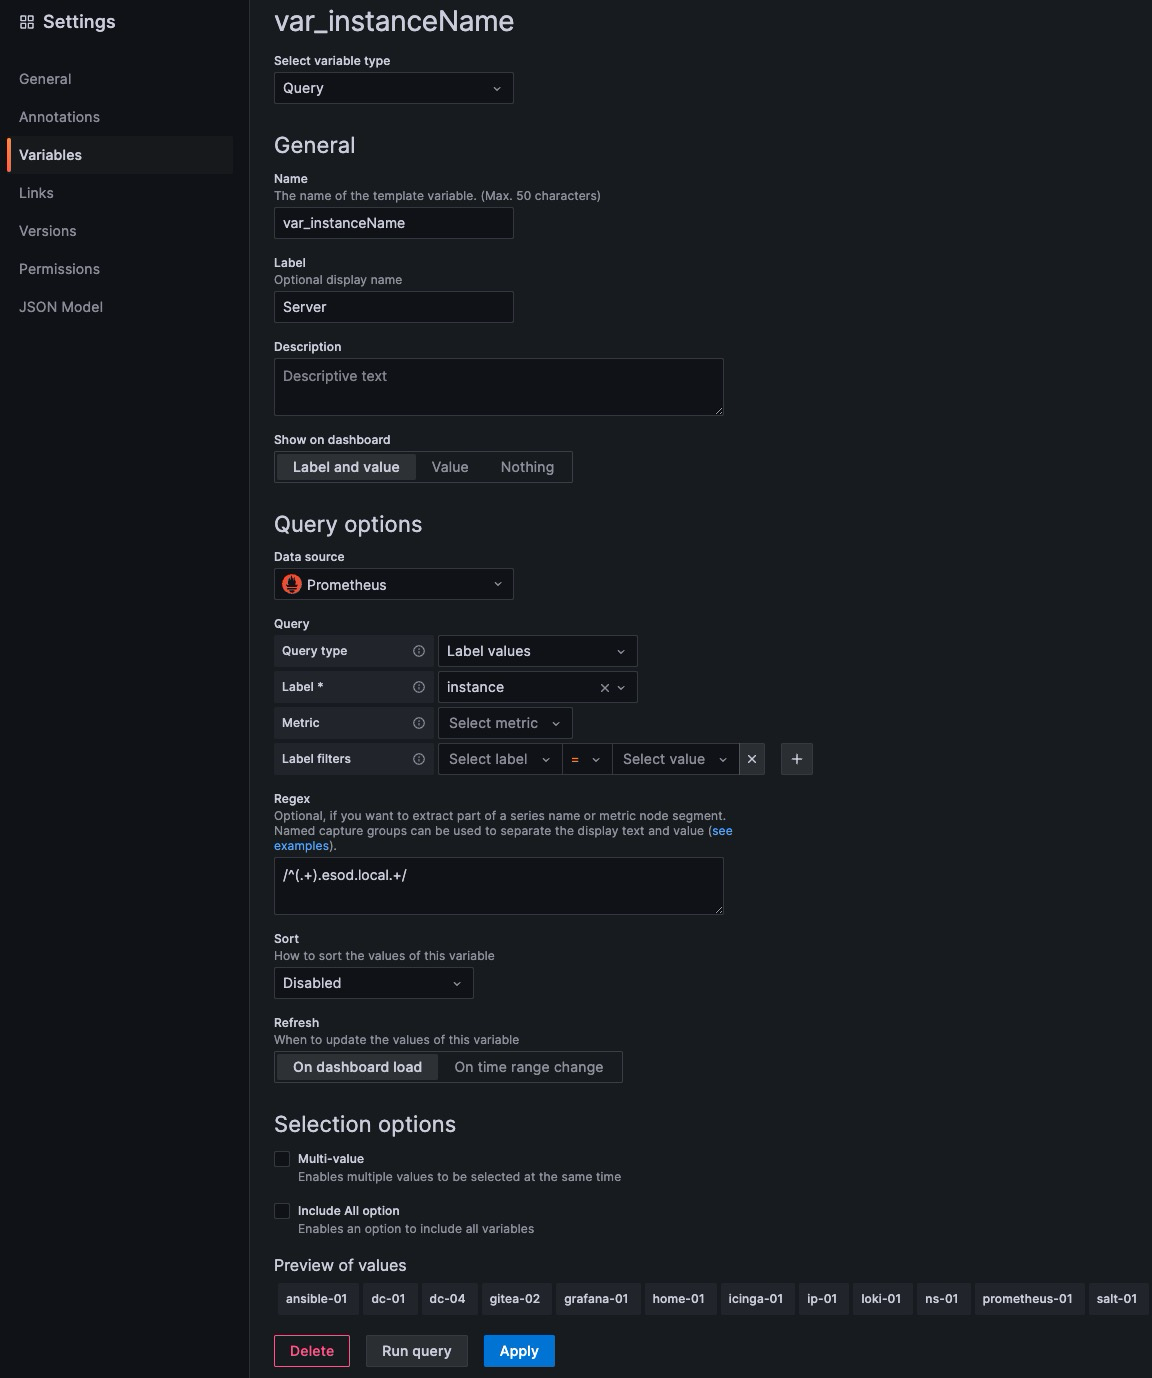
As the metrics and logs are from different sources (Prometheus and Loki, in this case), I also wanted to extract my “server name” (from the instance value), as the value was a bit different, based on what agent collects the data, and I needed a single value to further filter my views and output, based on a variable.
In my case, the server name (non-FQDN) fits perfectly, as it’s unique and available for querying both my metrics and logs, using the same value (either directly, or by using regex).
Extracting server name value of
ip-01into variable
- Value
ip-01extracted from Prometheus labelinstance="ip-01.esod.local:9100"(gathered via node_exporter)- Value
ip-01can be used directly with filtering Loki logs, which in my case will behost="ip-01"- Capture group being
/^(.+).esod.local.+/, which should translate to “beginning of the line”, and “everything before.esod.local*”, which is my internal lab domain.
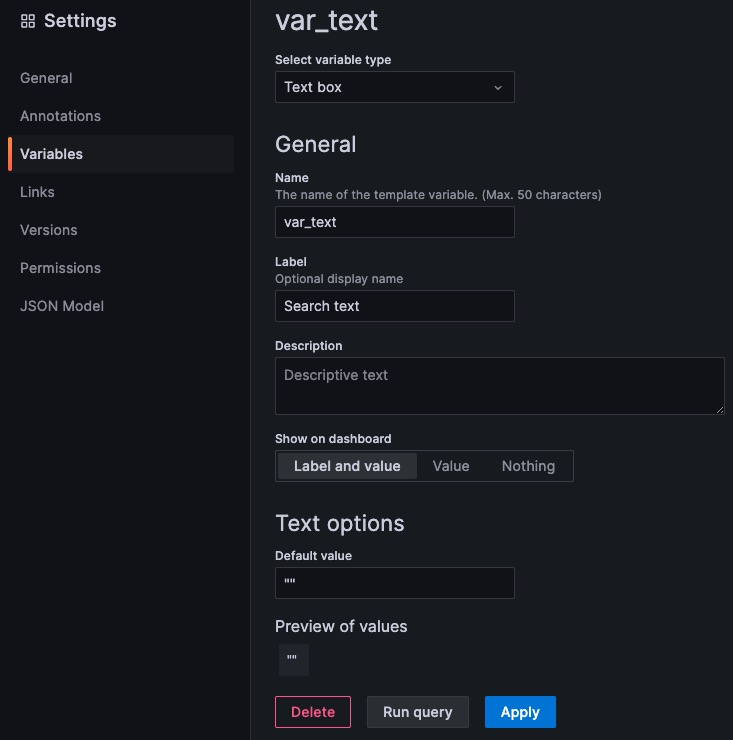
To further “filter” in the logs, I also added a simple variable from text box input (free typing), mainly to filter the log output, if needed.
Metrics query
My metrics are currently stored in Prometheus, and I’m currently using node_exporter to scrape the metrics.
Multiple ways to retrieve metrics
Using node_exporter and Prometheus is currently the (main) setup I use for collecting metrics on my Linux-based nodes, but you can, of course, use anything you like. It could be everything from the awesome Grafana Agent (which should cover multiple agents’ needs at once), all the way to manually sending metrics by e.g. scripting the
psoutput and crontab job to perform on a 1-second interval, which I actually do on macOS (mainly for troubleshooting processes-specific issues, based on process-specific metrics).
The query below should return the “total CPU usage” on a server (sum of usage on all cores), by using the number 100 (percentage) and then subtracting the value retrieved from idle, which will leave all consumed resources (e.g. both user and system, in this case). It is of course possible to do this multiple ways, e.g. sum of values by retrieving multiple “modes” like user and system, or we could also get the actual values from each process (which I also poll, using process-exporter), but for this example, I’ll focus on “total CPU usage”, only.
So for the metrics, PromQL-style, I use
100-(sum by (instance) (irate(node_cpu_seconds_total{mode="idle",instance=~"^${var_instanceName}.+"}[$__rate_interval])) / on(instance) group_left sum by (instance)((irate(node_cpu_seconds_total[$__rate_interval]))) * 100)Log query
Using Loki and LogQL here. In this case, I want to see “everything”, hence only needing the host label (and value).
{host=~"^${var_instanceName}"} |= ${var_text}Note that you may skip the whole
|= ${var_text}part if you don’t need to drill down (filter) into log details
Second example
In the example below, notice that (solely) based on CPU metrics, we can notice an unusual spike at around ~07:25. Maybe a bit more “tricky” to spot, depending on how well your eye is trained for this.
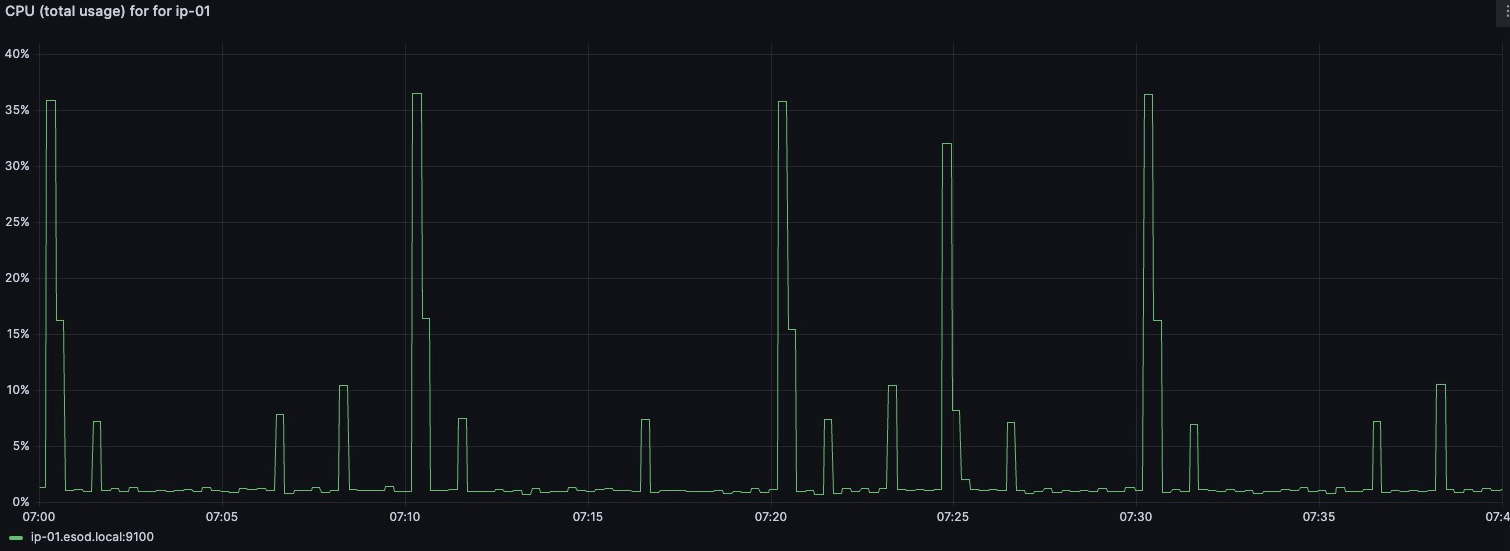
By “zooming into” the spike in CPU usage, we immediately see what the logs are telling us (in this case, open-vm-tools being upgraded)
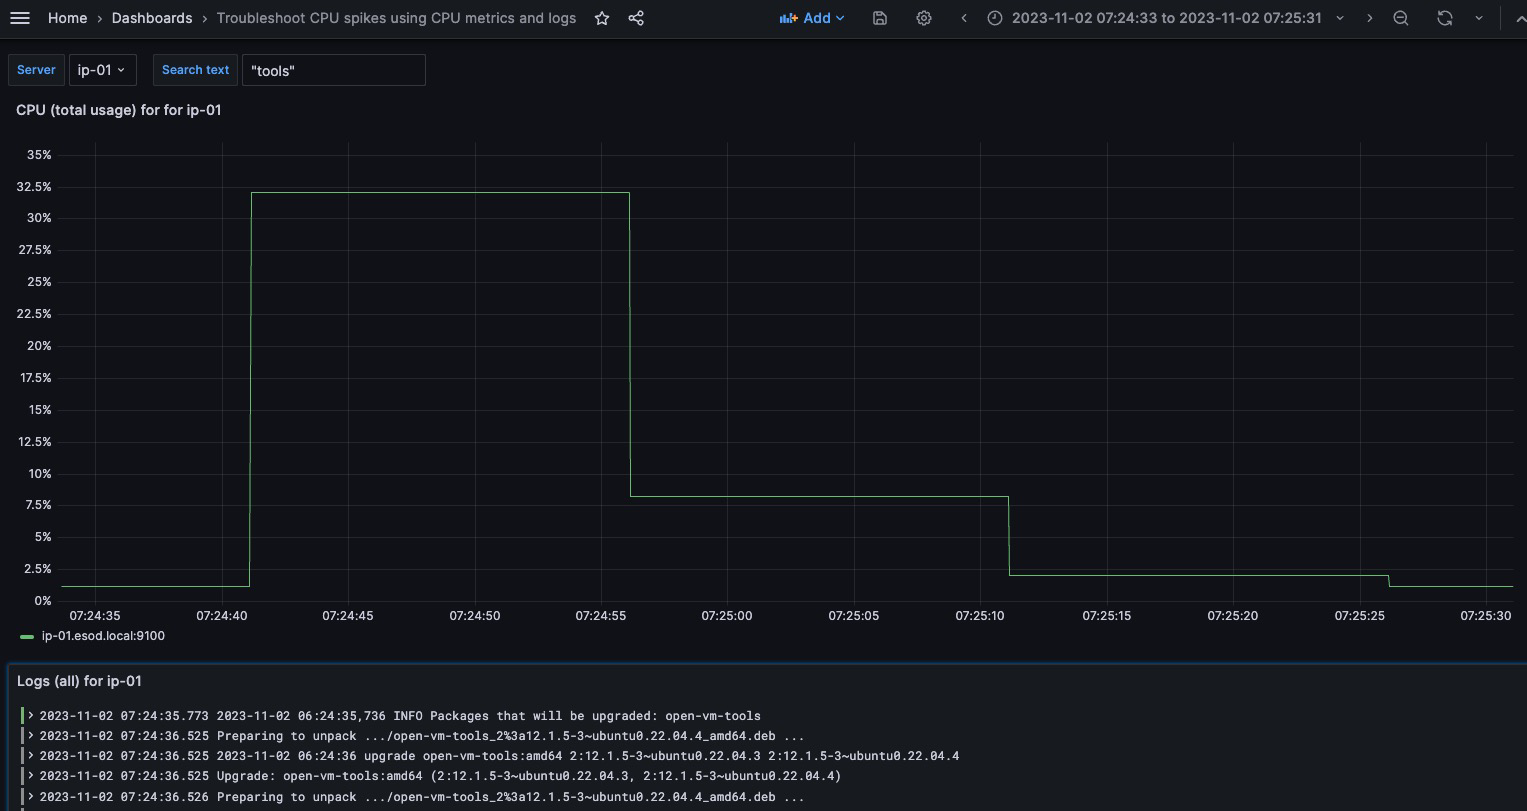
Notice that I’ve also filtered on log entries containing the text “tools” (since I already know the reason here, but wanted to filter the log output, while troubleshooting)
A third example, using Grafana Explore
On-demand queries using Grafana Explore
In the example below, I’m using Grafana Explore for my “on-demand troubleshooting”. I’m mainly using “Mixed” views, e.g. both viewing graphs (for CPU usage metrics), simultaneously with viewing logs directly from Loki (for events and details).
The example below is also relatively simple, but hopefully, you get the idea of what is possible to quickly set up (without any dashboard configuration)
Note that I’m using the very same server (ip-01), as before, but this time I hard code the values directly into the queries, in Grafana Explore. Remember that this is more of a “live troubleshooting” session (at least that’s how I use it).
Metrics query
100-(sum by (instance) (irate(node_cpu_seconds_total{mode="idle",instance="ip-01.esod.local:9100"}[$__rate_interval])) / on(instance) group_left sum by (instance)((irate(node_cpu_seconds_total[$__rate_interval]))) * 100)Log query
{host="ip-01"}By visualizing CPU usage metrics, we see that a CPU usage spike occurs about every 10 minutes, at around 40% CPU (being the sum of all cores, in this case).
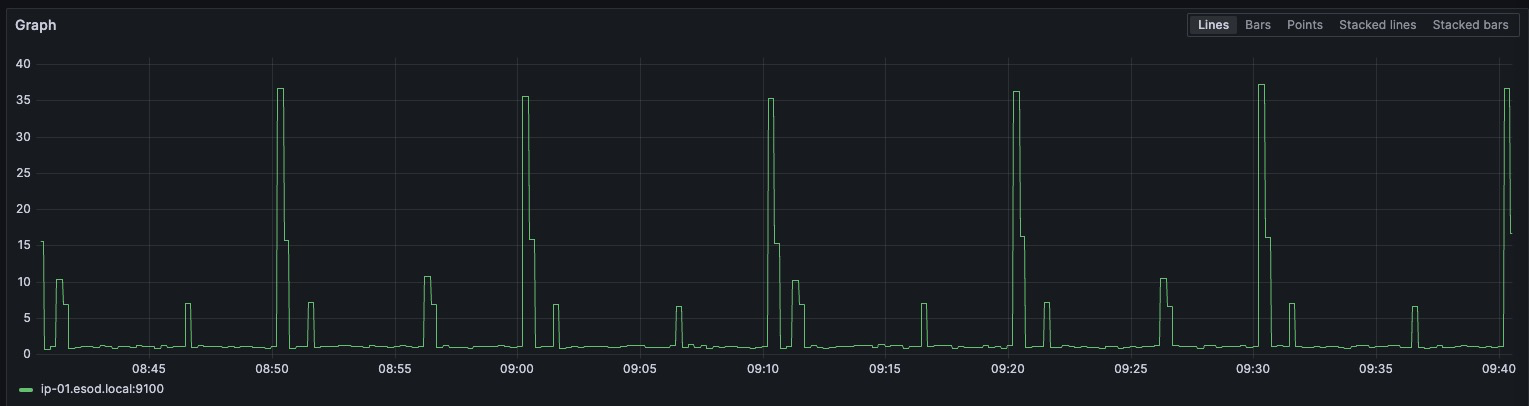
Note that the pattern repeats itself about every 10 minutes
If we then “zoom in” to the occurrence at 09:30 (CEST), by simply “selecting the timespan” using graph view, we also limit the timespan of entries to view from the logs (by adding the same timespan to Loki results, in this case).
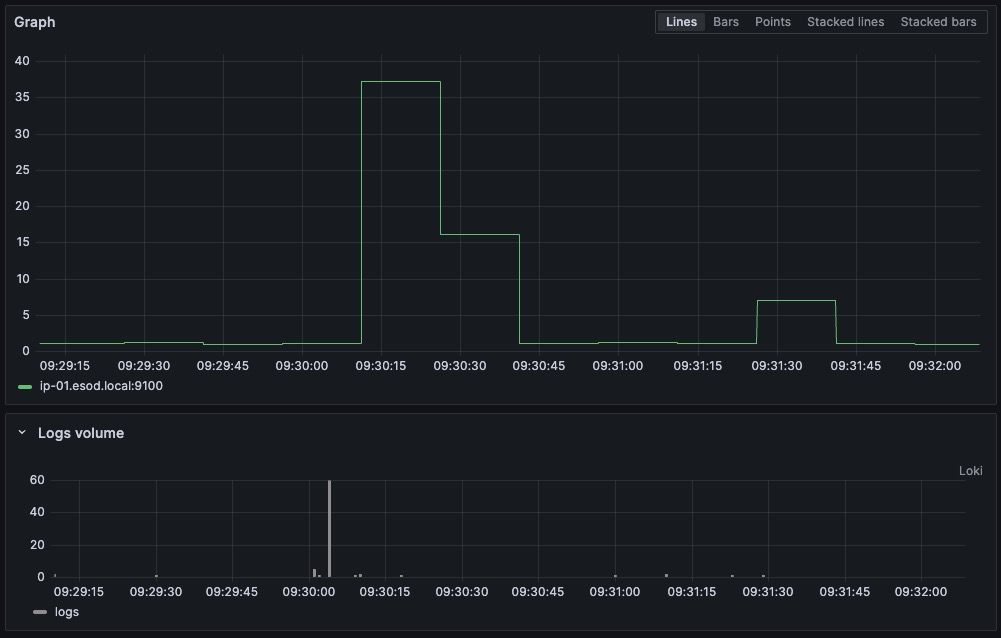
From the logs, in the same timeframe that the spike in CPU usage occurs, the logs from server ip-01 tell us it have just started multiple scheduled crontab jobs, including discoveryCheck, pingCheck and resolveIPaddresses. This being from my phpIPAM, I already now what it does, but let’s have a quick look.
Common labels: {"host":"ip-01"}
Line limit: "1000 (76 returned)"
Total bytes processed: "10.6  kB"


2023-11-15T09:30:00+01:00	crond: USER apache pid 3665126 cmd /usr/bin/php /phpipam/functions/scripts/discoveryCheck.php
2023-11-15T09:30:00+01:00	crond: USER apache pid 3665127 cmd /usr/bin/php /phpipam/functions/scripts/pingCheck.php
2023-11-15T09:30:00+01:00	crond: USER apache pid 3665128 cmd /usr/bin/php /phpipam/functions/scripts/resolveIPaddresses.php
2023-11-15T09:30:00+01:00	crond: USER root pid 3665129 cmd run-parts /etc/periodic/15min
2023-11-15T09:30:00+01:00	discoveryCheck: Scan start, 1354 IPs
2023-11-15T09:30:01+01:00	pingCheck: Scan start, 424 IPs
2023-11-15T09:30:03+01:00	updated ip address 10.x.x.x with dns-record.x.esod.local
2023-11-15T09:30:03+01:00	updated ip address 10.x.x.x with dns-record.x.esod.local
2023-11-15T09:30:03+01:00	updated ip address 10.x.x.x with dns-record.x.esod.local
2023-11-15T09:30:03+01:00	updated ip address 10.x.x.x with dns-record.x.esod.local
2023-11-15T09:30:03+01:00	updated ip address 10.x.x.x with dns-record.x.esod.local
2023-11-15T09:30:03+01:00	updated ip address 10.x.x.x with dns-record.x.esod.local
2023-11-15T09:30:03+01:00	updated ip address 10.x.x.x with dns-record.x.esod.local
2023-11-15T09:30:03+01:00	updated ip address 10.x.x.x with dns-record.x.esod.local
2023-11-15T09:30:03+01:00	updated ip address 10.x.x.x with dns-record.x.esod.local
2023-11-15T09:30:03+01:00	updated ip address 10.x.x.x with dns-record.x.esod.local
2023-11-15T09:30:03+01:00	updated ip address 10.x.x.x with dns-record.x.esod.local
2023-11-15T09:30:03+01:00	updated ip address 10.x.x.x with dns-record.x.esod.local
2023-11-15T09:30:03+01:00	updated ip address 10.x.x.x with dns-record.x.esod.local
2023-11-15T09:30:03+01:00	updated ip address 10.x.x.x with dns-record.x.esod.local
2023-11-15T09:30:03+01:00	updated ip address 10.x.x.x with dns-record.x.esod.local
2023-11-15T09:30:03+01:00	updated ip address 10.x.x.x with dns-record.x.esod.local
2023-11-15T09:30:03+01:00	updated ip address 10.x.x.x with dns-record.x.esod.local
2023-11-15T09:30:03+01:00	updated ip address 10.x.x.x with dns-record.x.esod.local
2023-11-15T09:30:03+01:00	updated ip address 10.x.x.x with dns-record.x.esod.local
2023-11-15T09:30:03+01:00	updated ip address 10.x.x.x with dns-record.x.esod.local
2023-11-15T09:30:03+01:00	updated ip address 10.x.x.x with dns-record.x.esod.local
2023-11-15T09:30:03+01:00	updated ip address 10.x.x.x with dns-record.x.esod.local
2023-11-15T09:30:03+01:00	updated ip address 10.x.x.x with dns-record.x.esod.local
2023-11-15T09:30:03+01:00	updated ip address 10.x.x.x with dns-record.x.esod.local
2023-11-15T09:30:03+01:00	updated ip address 10.x.x.x with dns-record.x.esod.local
2023-11-15T09:30:03+01:00	updated ip address 10.x.x.x with dns-record.x.esod.local
2023-11-15T09:30:03+01:00	updated ip address 10.x.x.x with dns-record.x.esod.local
2023-11-15T09:30:03+01:00	updated ip address 10.x.x.x with dns-record.x.esod.local
2023-11-15T09:30:03+01:00	updated ip address 10.x.x.x with dns-record.x.esod.local
2023-11-15T09:30:03+01:00	updated ip address 10.x.x.x with dns-record.x.esod.local
2023-11-15T09:30:03+01:00	updated ip address 10.x.x.x with dns-record.x.esod.local
2023-11-15T09:30:03+01:00	updated ip address 10.x.x.x with dns-record.x.esod.local
2023-11-15T09:30:03+01:00	updated ip address 10.x.x.x with dns-record.x.esod.local
2023-11-15T09:30:03+01:00	updated ip address 10.x.x.x with dns-record.x.esod.local
2023-11-15T09:30:03+01:00	updated ip address 10.x.x.x with dns-record.x.esod.local
2023-11-15T09:30:03+01:00	updated ip address 10.x.x.x with dns-record.x.esod.local
2023-11-15T09:30:03+01:00	updated ip address 10.x.x.x with dns-record.x.esod.local
2023-11-15T09:30:03+01:00	updated ip address 10.x.x.x with dns-record.x.esod.local
2023-11-15T09:30:03+01:00	updated ip address 10.x.x.x with dns-record.x.esod.local
2023-11-15T09:30:03+01:00	updated ip address 10.x.x.x with dns-record.x.esod.local
2023-11-15T09:30:03+01:00	updated ip address 10.x.x.x with dns-record.x.esod.local
2023-11-15T09:30:03+01:00	updated ip address 10.x.x.x with dns-record.x.esod.local
2023-11-15T09:30:03+01:00	updated ip address 10.x.x.x with dns-record.x.esod.local
2023-11-15T09:30:03+01:00	updated ip address 10.x.x.x with dns-record.x.esod.local
2023-11-15T09:30:03+01:00	updated ip address 10.x.x.x with dns-record.x.esod.local
2023-11-15T09:30:03+01:00	updated ip address 10.x.x.x with dns-record.x.esod.local
2023-11-15T09:30:03+01:00	updated ip address 10.x.x.x with dns-record.x.esod.local
2023-11-15T09:30:03+01:00	updated ip address 10.x.x.x with dns-record.x.esod.local
2023-11-15T09:30:03+01:00	updated ip address 10.x.x.x with dns-record.x.esod.local
2023-11-15T09:30:03+01:00	updated ip address 10.x.x.x with dns-record.x.esod.local
2023-11-15T09:30:03+01:00	updated ip address 10.x.x.x with dns-record.x.esod.local
2023-11-15T09:30:03+01:00	updated ip address 10.x.x.x with dns-record.x.esod.local
2023-11-15T09:30:03+01:00	updated ip address 10.x.x.x with dns-record.x.esod.local
2023-11-15T09:30:03+01:00	updated ip address 10.x.x.x with dns-record.x.esod.local
2023-11-15T09:30:03+01:00	updated ip address 10.x.x.x with dns-record.x.esod.local
2023-11-15T09:30:03+01:00	updated ip address 10.x.x.x with dns-record.x.esod.local
2023-11-15T09:30:03+01:00	updated ip address 10.x.x.x with dns-record.x.esod.local
2023-11-15T09:30:03+01:00	updated ip address 10.x.x.x with dns-record.x.esod.local
2023-11-15T09:30:03+01:00	updated ip address 10.x.x.x with dns-record.x.esod.local
2023-11-15T09:30:03+01:00	updated ip address 10.x.x.x with dns-record.x.esod.local
2023-11-15T09:30:08+01:00	updated ip address 10.x.x.x with dns-record.x.esod.local
2023-11-15T09:30:17+01:00	pingCheck: Scan complete, 0 updates
2023-11-15T09:30:17+01:00	discoveryCheck: Scan complete, 0 new hosts
The jobs can also be verified by checking the crontab, in this case running within a Docker container, but the same would apply to any scheduled job
❯ docker exec -it phpipam-phpipam-cron-1 cat /etc/crontabs/apache
*/10 * *  *  * /usr/bin/php /phpipam/functions/scripts/discoveryCheck.php
*/10 * *  *  * /usr/bin/php /phpipam/functions/scripts/pingCheck.php
*/10 * *  *  * /usr/bin/php /phpipam/functions/scripts/resolveIPaddresses.php